How to read a load test report: p95, error rate, throughput, and the line between slow and broken
On this page
A load test produces thousands of numbers and a report that fits on a page. Reading that page well is the difference between a test that changes something and a test that gets filed. This article is a guide to the page: what each figure means, which ones mislead on their own, how they relate, and how to go from a report to a decision about what to fix.
The examples use the figures a BCDRPulse report shows, but every serious tool reports the same four things, because the four things are what a site under load actually does.
The four measurements
Every load test records, across the whole run, how long requests took, how many were served per second, and how many failed. Reports present those as:
Response time, as a distribution. Not one number but several: the median (p50), the 95th percentile (p95), the 99th (p99) and the maximum. More on why below.
Time to first byte (TTFB). How long the server took to start answering, before any content transferred. It isolates the backend’s thinking time from the size of the page. Google’s guidance treats 0.8 seconds or less as good for real users; a server’s share under test should be far lower.
Throughput. Requests served per second at the tested concurrency. This is the capacity reading.
Error rate. The share of requests that failed, and what the failures were: HTTP 5xx from the application, 429 or 503 from a rate limit, timeouts where nothing came back.
Google’s site reliability engineers call the same set the four golden signals, latency, traffic, errors and saturation, and the fourth, saturation, is what the relationship between the first three reveals.
Why the report leads with percentiles
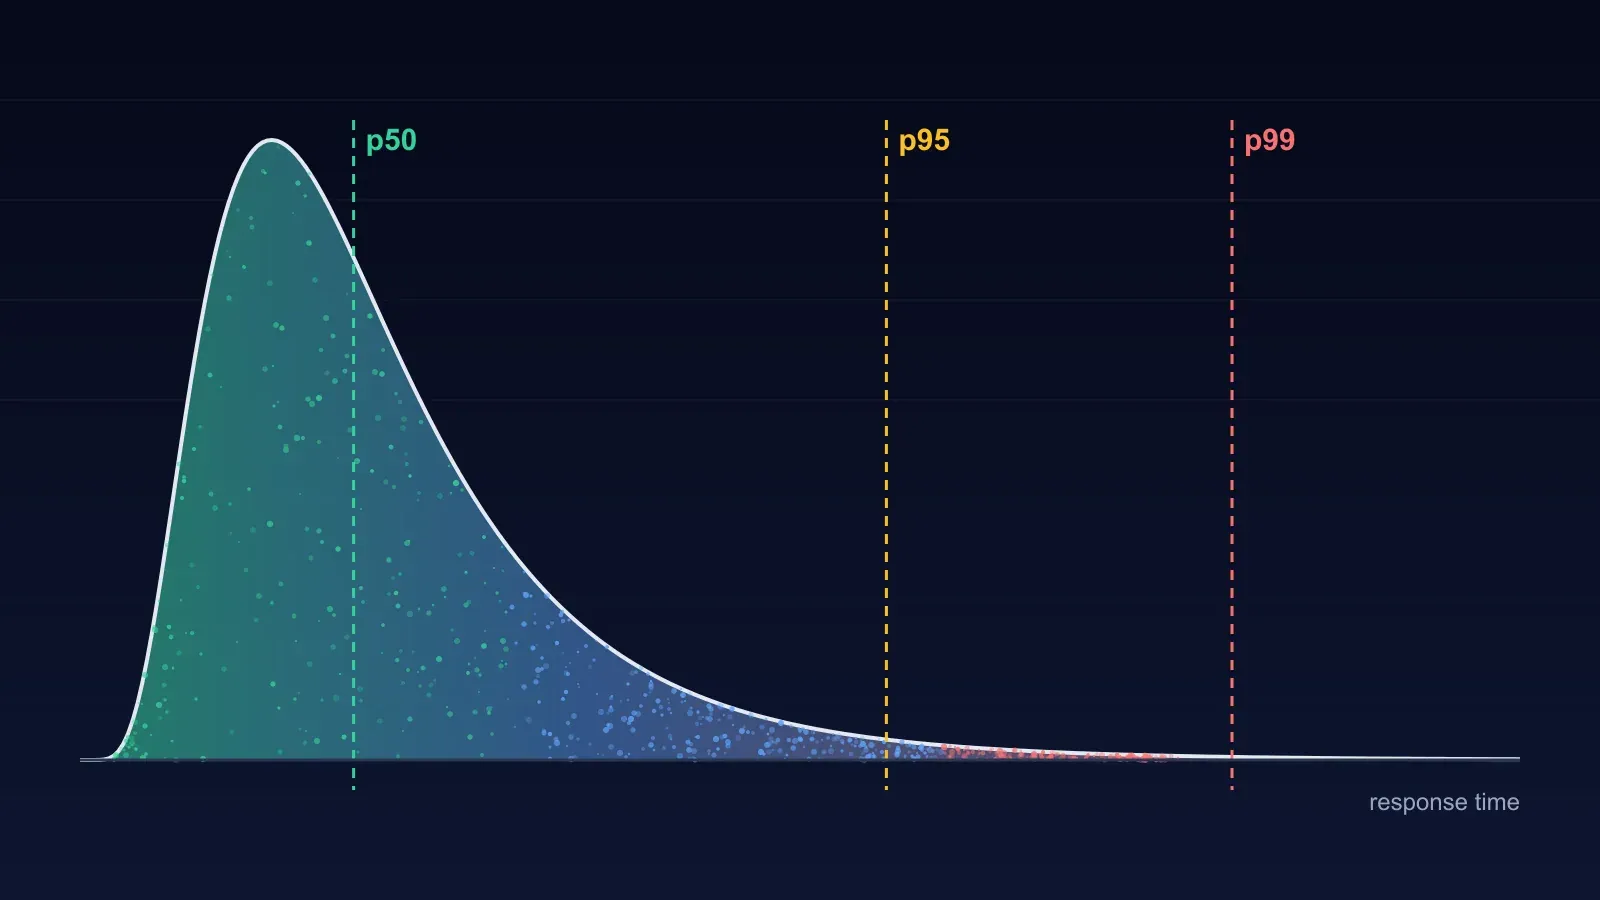
Response times are not spread evenly. Most requests cluster around a fast value and a small number take far longer, because they hit an uncached query, waited for a lock, landed on a busy worker or triggered garbage collection. The result is a curve with a tall peak and a long tail to the right.
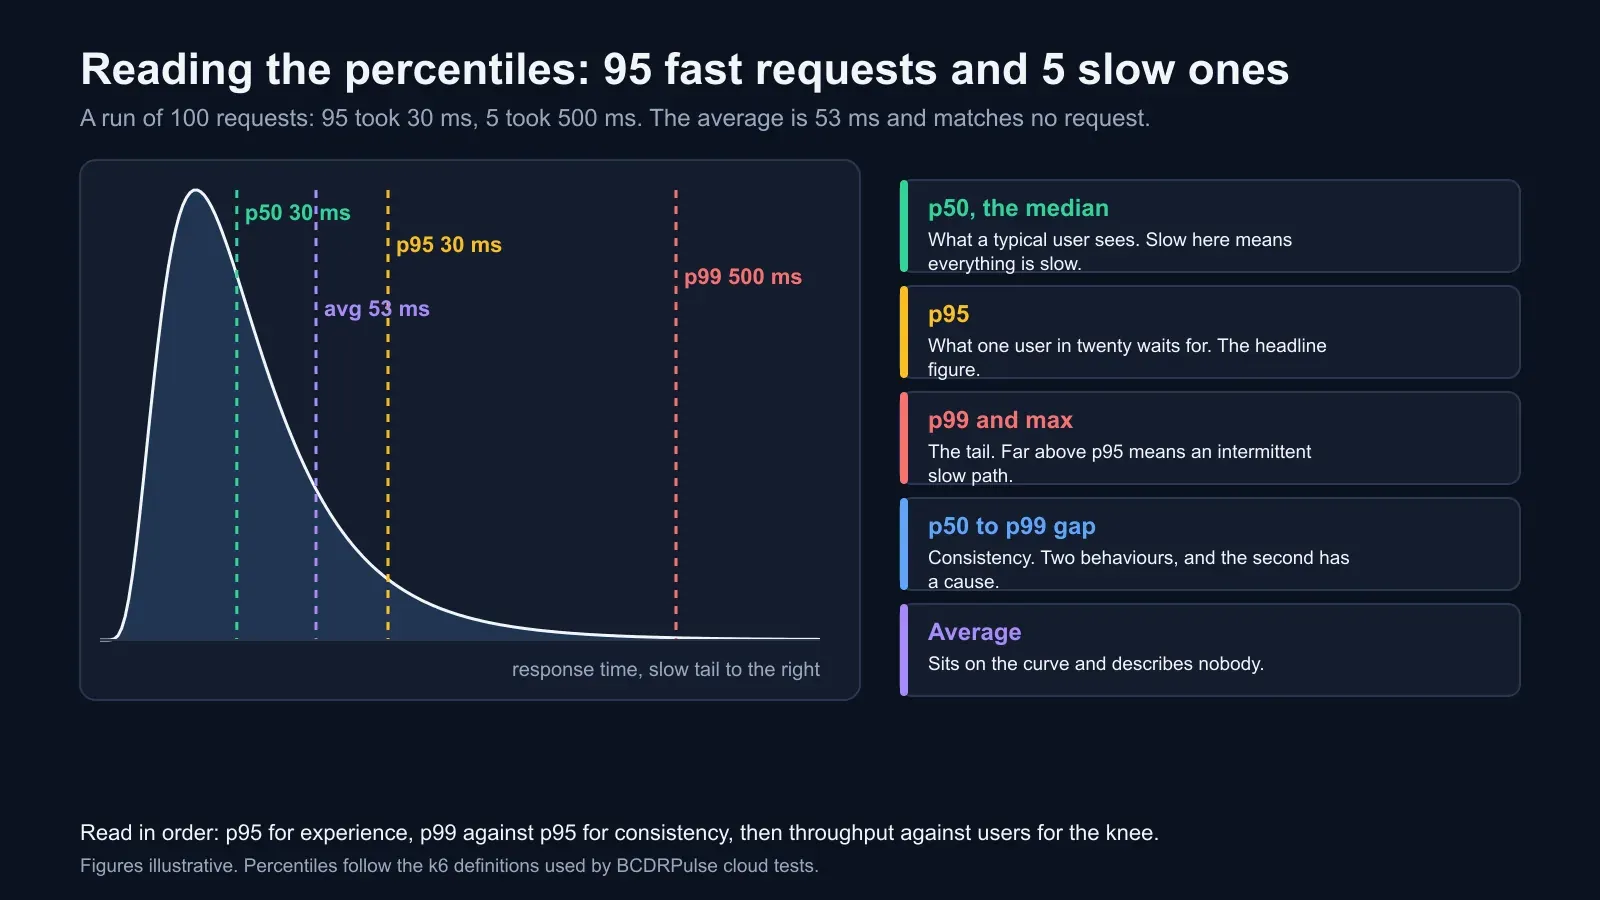
An average sits somewhere on that curve and describes nobody. Take a run where 95 requests took 30 milliseconds and five took 500. The average is 53 milliseconds, which sounds fine and matches no actual request. The p95 is 30 and the p99 is 500, which tells the truth: almost everyone had a fast experience, and one visitor in twenty hit something ten times slower. On a quiet day that is an annoyance. On a busy day the one in twenty is a hundred people an hour, and they are the ones who refresh.
So read the percentiles in order:
- p50, the median. What a typical user sees. If this is slow, everything is slow and the fix is architectural: caching, a faster host, a lighter page.
- p95. What one user in twenty waits for. The headline figure in most reports because it reflects experience without being dominated by freak outliers.
- p99 and the maximum. The tail. If p99 is far above p95, something intermittent is happening: contention, a slow dependency, a cache that sometimes misses.
- The gap between p50 and p99. Consistency. A site with a 20 millisecond median and a 400 millisecond p99 is not a fast site with a few slow requests; it is a site with two behaviours, and the second one has a cause worth finding. BCDRPulse scores this as a consistency figure out of 100, and a low score on a fast average is the report’s most common surprise.
Throughput, concurrency and the knee
Throughput and response time are not independent. The number of users being served at any instant equals the requests served per second multiplied by how long each one takes. Fifty concurrent users and a 100 millisecond response time means about 500 requests per second; the same fifty users at a one-second response time means fifty.
That relationship is what a rising load test exposes. As the test adds users, throughput rises and response time stays roughly flat, because the site has spare capacity. At some point throughput stops rising. Every additional user now waits for the same database connections, worker processes or CPU, so response time climbs instead. That point is the knee, and the throughput at the knee is the site’s capacity on the tested path.
Reading it from a report:
- Throughput rising with users, response time flat: below capacity. Raise the load, or stop here if this is the traffic you expect and record the headroom.
- Throughput flat, response time rising: at capacity. The throughput figure is your number; the response time is what users feel there.
- Throughput falling, errors rising: past capacity. The site is spending its effort on failing requests. This is the stress test’s territory, and the point where you want to see recovery.
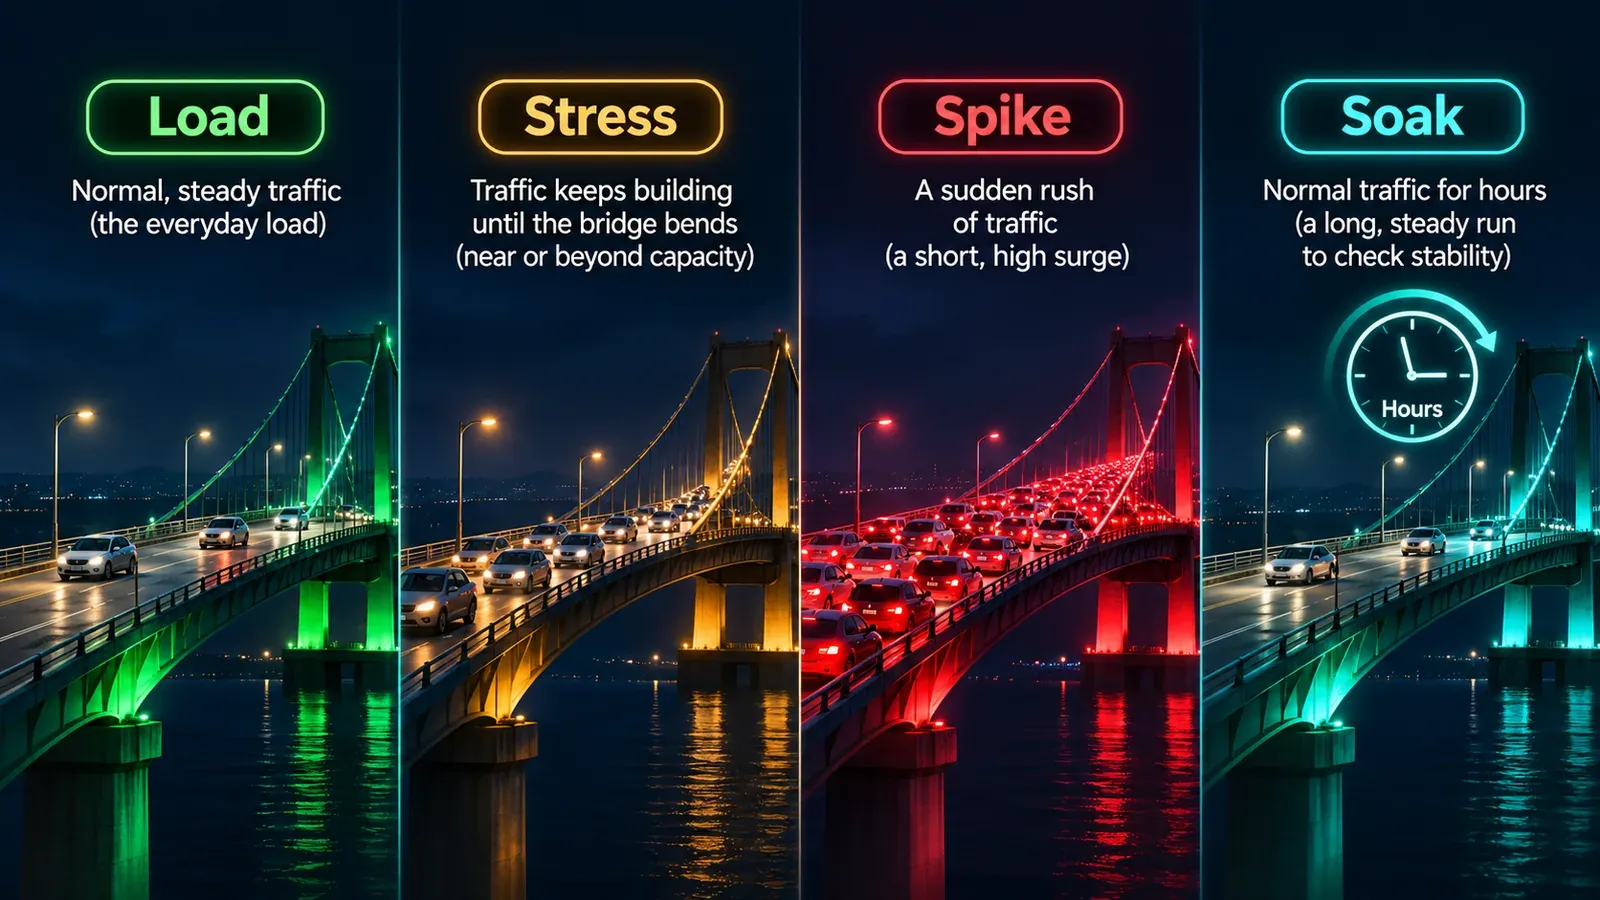
Our explainer on load, stress, spike and soak tests covers which test to run to find each of these.
Errors are a separate event from slowness
A site that slows down is in a different state from a site that fails, even at the same p95, and the report should let you tell them apart.
Note three things about errors. The load at which the first one appeared, because that is the hard limit, as opposed to the soft one where response times began climbing. The status codes, because they point at the cause: 500 and 502 are the application or its upstream failing; 503 and 429 are a rate limit or a protective cut-off, sometimes yours and sometimes a third party’s; a timeout with no response is a request that queued until the test runner gave up, which usually means the web tier is fine and something behind it is not. Whether errors cleared when the load dropped, because errors that persist after the pressure lifts mean something stayed broken, a connection pool that did not recover or a service that needed a restart.
At the traffic you expect, the acceptable error rate is zero. A fraction of a per cent is not noise: at a thousand orders an hour, half a per cent is five lost orders every hour, each one a customer who saw an error page at the payment step.
The stress report adds three figures
A stress test keeps raising the load past the expected level, so its report describes change rather than a level. BCDRPulse’s stress report leads with:
- Degradation factor. How much slower the site got from baseline to peak load, as a multiple. 1.2 times means the site barely noticed; 6 times means a bottleneck surfaced.
- Error onset. The load at which requests first failed, or “none” if the site held every request to the top of the ramp.
- Peak p95. The 95th percentile at the hardest point of the test.
- Recovery. How quickly response times returned to baseline once the load lifted. Instant recovery means no lasting exhaustion; slow recovery means a queue or a leak that outlived the test, which on a real busy day becomes the outage that continues after the traffic has gone.
The last figure is the one load tests cannot give you, and for a site that expects a spike it is the one that matters most. A site that degrades to three times its baseline and recovers in seconds will survive a spike with a slow ten minutes. A site that degrades less but takes five minutes to recover will still be struggling when the second wave arrives.
The result that is too good
A report with a low p95, zero errors and a flat line all the way up can mean one of three things, and the report cannot tell you which.
The page may be cached at a content delivery network, so the test never reached your server and the result describes the CDN’s capacity, which is enormous. Test a page that cannot be cached, such as a search result, a cart or a logged-in page, and compare. The concurrency may simply have been too low to reach any limit, which is the usual reading of a light edge test on a healthy site and the reason the cloud load and cloud stress tests exist for higher volumes. Or the site is genuinely fast at that load, which is good news with a next step: the stress test, to find where it stops being.
From the report to a decision
The report’s job is to point at the first thing to fix. A short mapping from what the figures show to where to look:
| What the report shows | What it usually means | Where to look first |
|---|---|---|
| High median, tight percentiles | Everything is slow, consistently | Hosting tier, page weight, missing page cache |
| Fast median, p99 far above p95 | Intermittent slow path | Uncached queries, object cache, locks, a slow third-party call |
| Throughput flat while users rise | Bottleneck reached | Database connection pool, PHP or app workers, CPU |
| Errors begin before response times climb | A hard limit, not exhaustion | Rate limits, connection limits, a dependency’s quota |
| Timeouts with no response | Queueing behind the web tier | Database, queue workers, upstream API |
| Slow recovery after load lifts | Something stayed exhausted | Connection leaks, queue backlogs, swap |
| Perfect result on a cacheable page | The CDN was tested | Rerun on a dynamic page |
One number in the report should end up in a sentence someone can act on: “the checkout holds 300 concurrent users with a p95 under 400 milliseconds and the first errors appear at 450; raising the database pool is the next step.” That sentence is the test’s output. The PDF is the evidence for it.
How BCDRPulse reports it
Every BCDRPulse load test runs against a domain you have verified you own and reports the four measurements with p50, p95 and p99 rather than an average, a consistency score for the gap between them, and a written summary that names the first thing to look at. The stress test adds the degradation factor, error onset, peak p95 and recovery. Both come as a downloadable report, which is the artefact an auditor, an insurer or a client asks for when they want proof the site was tested rather than a statement that it was. The edge tests are light by design; the cloud tests on the Business plan drive hundreds to a thousand-plus virtual users for sites whose busy hour is bigger than that.
Checklist for reading any report
- Read p95 before the average, and p99 against p95 for consistency
- Find the knee: the load where throughput stops rising and response time starts climbing
- Note the load at the first error, the status codes, and whether errors cleared afterwards
- Check recovery time, not only peak response time
- Ask whether the tested page could have been cached, and rerun on a dynamic page if so
- Write the one actionable sentence the report supports, with the number in it
The bottom line
A load test report is four measurements and a shape. The percentiles tell you what users feel and how consistently; throughput against users tells you where capacity ends; errors tell you where the hard limit is and what kind; recovery tells you whether a spike leaves a mark. Read them in that order and the report stops being a page of numbers and becomes the one sentence that tells you what to fix next.
Sources.
- 1. Google, web.dev: Time to First Byte (a good TTFB is 0.8 seconds or less) (opens in a new tab) web.dev
- 2. Google, web.dev: Core Web Vitals thresholds (LCP 2.5 s, INP 200 ms, CLS 0.1) (opens in a new tab) web.dev
- 3. Google, Site Reliability Engineering: Monitoring distributed systems (the four golden signals: latency, traffic, errors, saturation) (opens in a new tab) sre.google
- 4. Grafana k6 documentation: metrics and thresholds (p(95), p(99), http_req_failed) (opens in a new tab) grafana.com
- 5. BCDRPulse, Load testing tool page: what the report measures (opens in a new tab) bcdrpulse.com
- 6. BCDRPulse, Stress testing tool page: degradation factor, error onset and recovery (opens in a new tab) bcdrpulse.com
Frequently asked questions.
What is p95 in a load test?
The response time that 95% of requests finished within during the run; the slowest 5% took longer. If the p95 is 400 milliseconds, nineteen requests in twenty were faster than that and one in twenty was slower. It is reported instead of the average because response times are skewed: a few very slow requests pull the average up while most users see something faster, and the average hides exactly the requests that frustrate people. p95 is the usual headline figure; p99 shows the tail more severely.
What is a good p95 response time?
For the server's part of the work, under a few hundred milliseconds for a dynamic page is a comfortable target, and Google's guidance treats a time to first byte of 0.8 seconds or less as good. The more useful test is relative: p95 within about two to three times the median means the site is consistent; a p95 ten times the median means some requests are hitting a slow path, such as an uncached database query or a lock, even if the median looks fine.
What error rate is acceptable in a load test?
Zero at the traffic you expect, and the report should say at what load the first error appeared if the test went beyond that. A fraction of a per cent at the expected load is a problem to investigate, not noise, because at a thousand orders an hour 0.5% is five lost orders an hour. Check what the errors were: 5xx responses from your application, timeouts from the test runner, 429 or 503 from a rate limit or a third-party service each point to a different fix.
Why does throughput stop increasing when I add more virtual users?
Because the site has reached a bottleneck and extra users are queuing rather than being served. Below the knee, adding users adds requests per second with response time roughly flat. At the knee, throughput levels off and response time starts climbing, because each new user waits for the same database connections, worker processes or CPU. The throughput at the knee is the site's capacity on the tested path, and the response time there is what users feel at that capacity.
Why does my load test show a perfect result?
Three common reasons. The page tested is cached at a CDN, so the test measured the CDN rather than your application; test a page that cannot be cached, such as a search or a cart. The concurrency was too low to reach any limit; raise it or move to a cloud-scale test. Or the site is simply fast at that load, which is a real result, and the stress test is the next step to find where it stops being.
What is the difference between a load test report and a stress test report?
A load test reports how the site behaved at a chosen traffic level: response time distribution, throughput and errors at that level. A stress test keeps raising the load and reports change: the degradation factor, which is how much slower the site got from baseline to peak; error onset, the load at which requests first failed; the peak p95; and recovery, how quickly response times returned to baseline after the load lifted. The load test answers whether the expected crowd fits; the stress test answers how much margin there is above it and what failure looks like.
Published .
Founder, BCDRPulse
Founder of BCDRPulse. Enterprise backup and data protection since 2007, supporting Fortune 500 companies. Writes guides to keeping a site up, fast and secure, and to proving it.